Powerful data
insights for all
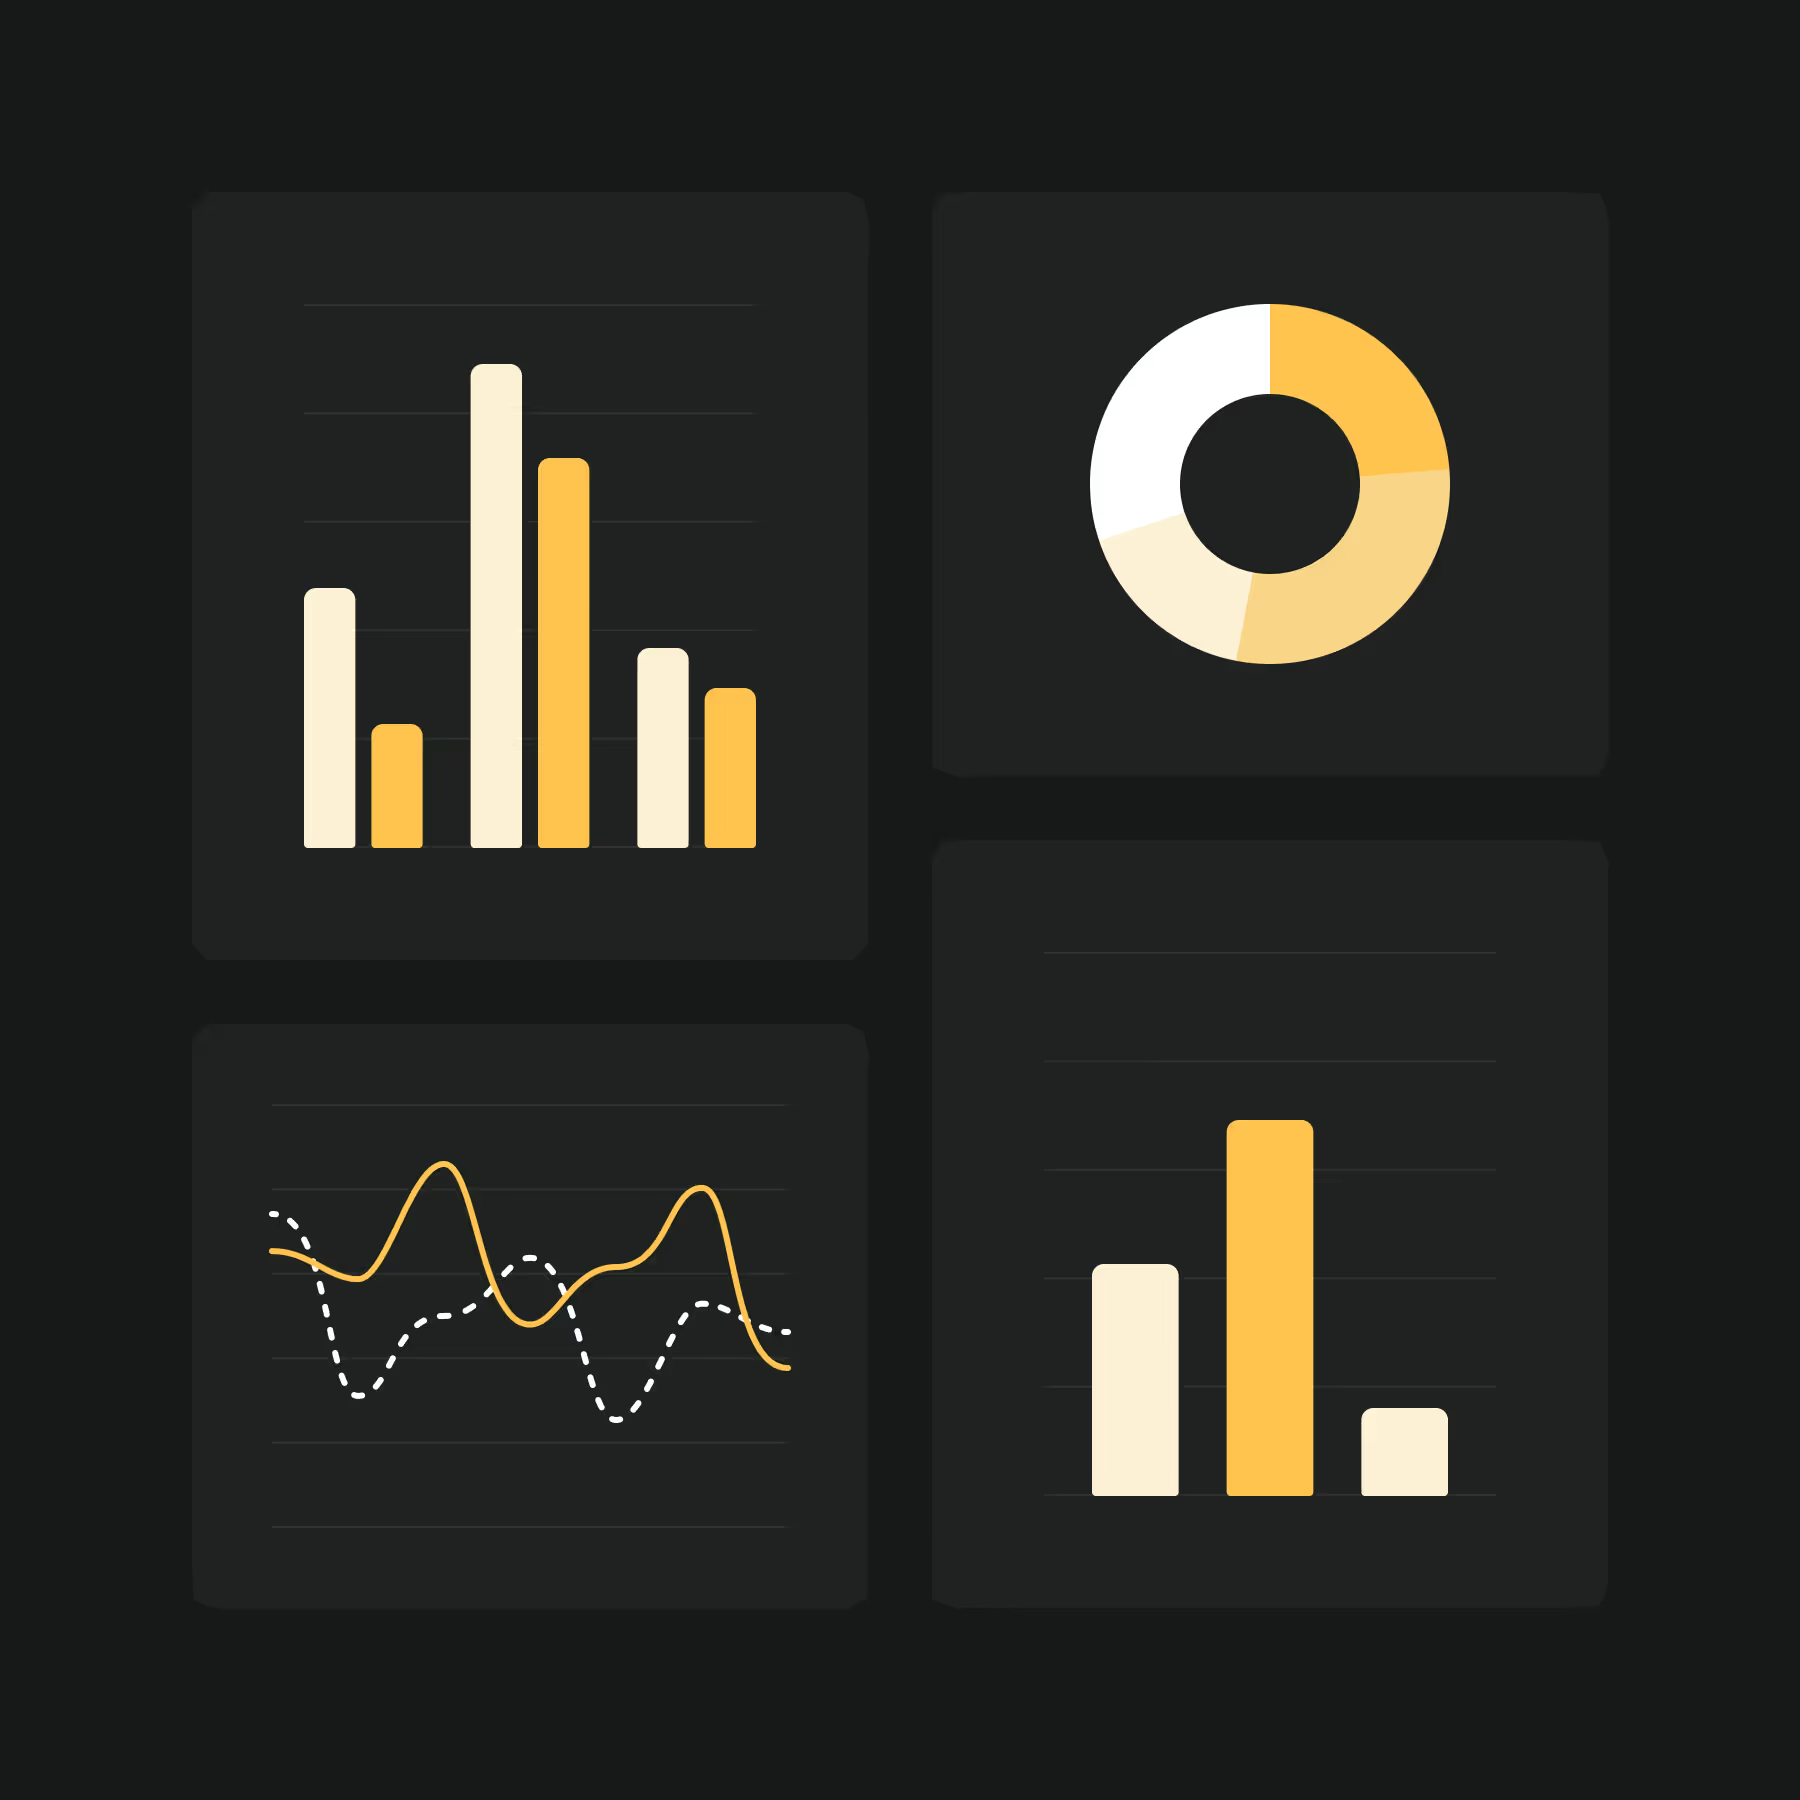
BinaryPath makes data analysis easy for everyone. Visualise key metrics, track performance, and discover trends without needing a data science background.

Take action from insights
Easy-to-use dashboards
Create intuitive, custom dashboards to visualise your most important metrics. No coding or technical skills required.
Real-time data updates
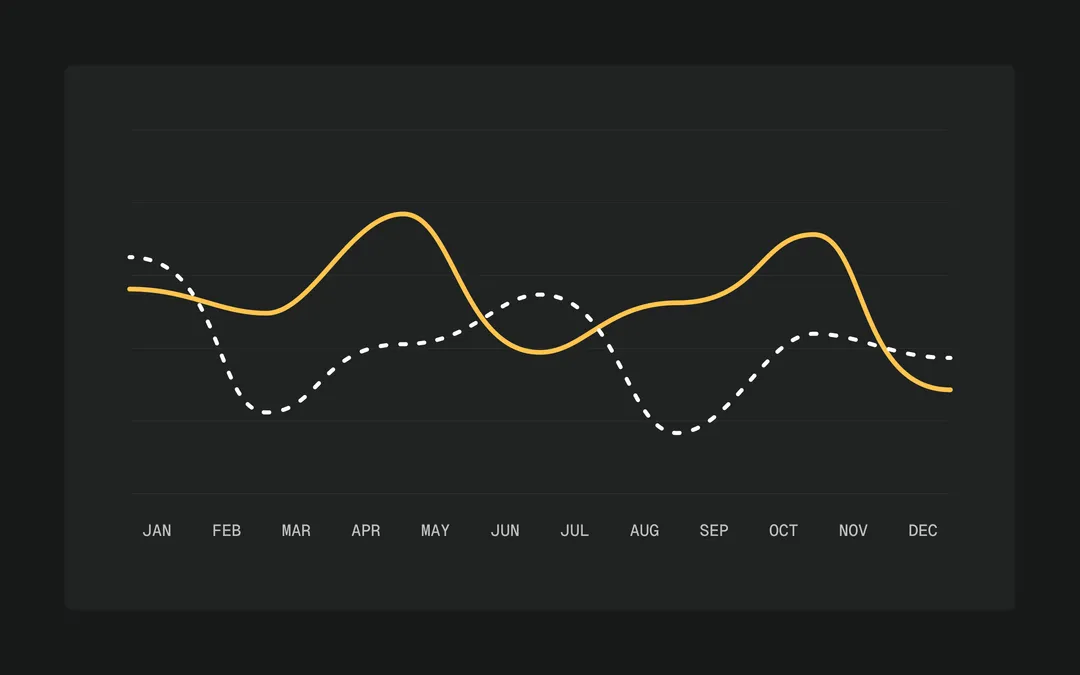
Get the latest insights with real-time data refreshes. Stay on top of changes as they happen, keeping your team informed.
Collaborative analytics
Share dashboards and reports with your team for seamless collaboration. Everyone stays aligned with the latest data.
Automated reports
Set up automated reports to be delivered directly to your inbox. Save time and ensure your team always has the latest insights.
Actionable insights
Turn complex data
Turn complex data
into simple decisions
